Building a Security Information and Event Management (SIEM) home lab is one of the most effective ways to learn threat hunting, security monitoring, incident response, and log analysis in a practical environment. Rather than relying solely on theoretical concepts, a SIEM lab allows you to generate, collect, and analyze real security events from your own systems.
In this tutorial, you’ll build a simple but powerful SIEM environment by:
- Installing Splunk Enterprise on an Ubuntu Server
- Installing Sysmon on a Windows machine
- Configuring the Splunk Universal Forwarder to forward Windows Event Logs to Splunk
- Verifying that Windows logs are successfully ingested into Splunk for analysis
By the end of this guide, you’ll have a functioning SIEM lab capable of collecting Windows security events, providing a strong foundation for detection engineering, threat hunting, and MITRE ATT&CK-based security research.
Lab Architecture
+-----------------------------+
|        Windows Machine      |
|-----------------------------|
| Sysmon                      |
| Splunk Universal Forwarder  |
+-------------+---------------+
              |
              | TCP 9997
              v
+-----------------------------+
|       Ubuntu Server         |
|-----------------------------|
| Splunk Enterprise           |
| Splunk Web (Port 8000)      |
+-----------------------------+
Requirements
Before starting, ensure you have the following:
- Ubuntu Server installed
- Windows machine (physical or virtual)
- Internet connectivity
- Administrative / root privileges
- Basic Linux command-line knowledge
Step 1 — Install Ubuntu Server
Install Ubuntu Server on your virtual machine or physical system.
After installation, log in and update the operating system:
sudo apt update
sudo apt upgrade -y
Step 2 — Download Splunk Enterprise
Visit the Splunk website and download the latest Splunk Enterprise (.deb) package, or download it directly using wget:
wget -O splunk-10.4.2-33c3bf42cd73-linux-amd64.deb "https://download.splunk.com/products/splunk/releases/10.4.2/linux/splunk-10.4.2-33c3bf42cd73-linux-amd64.deb"Step 3 — Install Splunk Enterprise
Install the downloaded package using dpkg:
sudo dpkg -i splunk-10.4.2-33c3bf42cd73-linux-amd64.debSplunk is installed by default in /opt/splunk.
Step 4 — Start Splunk and Enable Automatic Startup
Start the Splunk service:
sudo /opt/splunk/bin/splunk startDuring the first startup:
- Accept the license agreement
- Create a Splunk administrator username
- Create a strong password
Enable Splunk to start automatically when Ubuntu boots:
sudo /opt/splunk/bin/splunk enable boot-startStep 5 — Access Splunk Web
Open a web browser from your Windows machine and navigate to:
https://<Ubuntu_IP>:8000
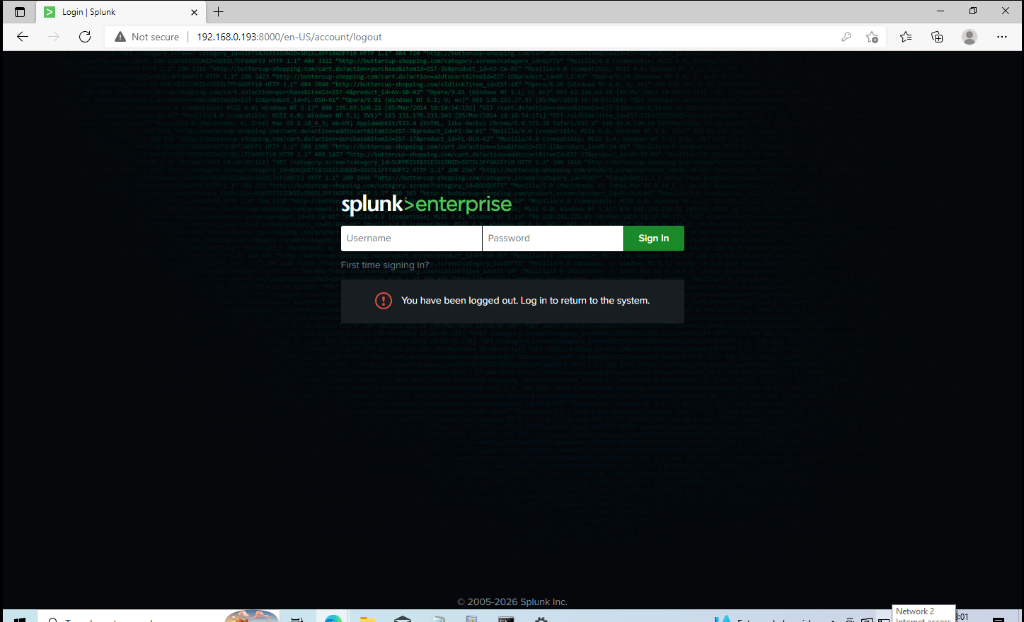
Log in using the administrator credentials created during installation. You should now see the Splunk Enterprise Login and Dashboard interface:
Step 6 — Prepare the Windows Machine
Install Windows on your virtual machine or physical system. This Windows machine will generate logs that will later be forwarded to Splunk.
Step 7 — Install Sysmon
Download Sysmon from the Microsoft Sysinternals Suite: https://learn.microsoft.com/en-us/sysinternals/downloads/sysmon
Open Command Prompt as Administrator and navigate to the folder containing Sysmon64.exe.
Install Sysmon:
Sysmon64.exe -iAfter installation, Sysmon begins logging detailed system activity such as:
- Process creation
- Network connections
- Driver loading
- Registry modifications
- File creation timestamps
These events greatly improve visibility compared to standard Windows Event Logs.
Step 8 — Verify the Sysmon Service
Open services.msc:
- Locate
Sysmon64 - Verify that
Status = Running
Step 9 — Install Splunk Universal Forwarder
Download the Splunk Universal Forwarder for Windows: https://www.splunk.com/en_us/download/universal-forwarder.html
Run the installer as Administrator and complete the installation using the default settings.
After installation, the default directory is:
C:\Program Files\SplunkUniversalForwarder\Step 10 — Configure inputs.conf
Navigate to:
C:\Program Files\SplunkUniversalForwarder\etc\system\local\inputs.confAdd the following configuration:
[WinEventLog://Security]
disabled = 0
index = windows

[WinEventLog://System]
disabled = 0
index = windows

[WinEventLog://Application]
disabled = 0
index = windows

[WinEventLog://Microsoft-Windows-Kernel-Thermal-Operational]
disabled = 0
index = windows
renderXml = true
This configuration enables forwarding for:
- Security Logs
- System Logs
- Application Logs
- Kernel Thermal Events
Step 11 — Configure outputs.conf
Navigate to:
C:\Program Files\SplunkUniversalForwarder\etc\system\local\outputs.confAdd the following configuration:
[tcpout]
defaultGroup = splunk_group

[tcpout:splunk_group]
server = <Ubuntu_IP>:9997
Replace <Ubuntu_IP> with your Ubuntu Server’s IP address.
Step 12 — Restart the Splunk Universal Forwarder
Open Command Prompt as Administrator.
Stop the service:
net stop SplunkForwarderStart the service:
net start SplunkForwarderEnsure the Windows Firewall allows outbound communication on TCP Port 9997.
Step 13 — Verify Log Collection in Splunk
Return to the Splunk Web interface.
Open the Search & Reporting application and run the following search:
index=windowsIf everything has been configured correctly, Windows events should begin appearing almost immediately:
- Security Events
- System Events
- Application Events
- Sysmon Events (if configured to write to the Windows Event Log)
Troubleshooting Tips
If no events appear in Splunk, verify the following:
- Splunk Enterprise is running.
- Splunk Web is accessible on port 8000.
- Splunk is configured to receive forwarded data on TCP port 9997.
- The Splunk Universal Forwarder service is running.
inputs.confandoutputs.confare located in thelocaldirectory.- The Windows Firewall allows outbound traffic on port 9997.
- Network connectivity exists between the Windows machine and the Ubuntu Server.
- The correct index name (
windows) is being searched.
Useful Commands:
Check Splunk status on Ubuntu:
sudo /opt/splunk/bin/splunk statusRestart Splunk on Ubuntu:
sudo /opt/splunk/bin/splunk restartRestart the Universal Forwarder on Windows:
net stop SplunkForwarder
net start SplunkForwarder
What You’ve Accomplished
Congratulations! You have successfully built a basic SIEM home lab capable of collecting Windows Event Logs into Splunk Enterprise.
Your environment now includes:
- Ubuntu Server hosting Splunk Enterprise
- Windows endpoint with Sysmon installed
- Splunk Universal Forwarder collecting Windows Event Logs
- Centralized log collection in Splunk
- A foundation for security monitoring and threat hunting
Next Steps
Now that your SIEM lab is operational, consider expanding it by exploring:
- Creating custom Splunk dashboards
- Writing Splunk Processing Language (SPL) searches
- Developing detection rules for suspicious activity
- Mapping detections to the MITRE ATT&CK framework
- Building alerting workflows for real-time threat detection
With this lab in place, you have a practical platform for learning SIEM engineering, detection engineering, incident response, and advanced cybersecurity research.