Introduction
Attackers who gain unauthorized access to a Linux system often rely on critical administrative and utility commands such as sudo, su, nmap, nc, curl, wget, python, and perl to perform reconnaissance, escalate privileges, execute scripts, and exfiltrate sensitive data.
I built this project to detect selected command executions on Linux by pairing the Linux Auditing System (Auditd) with Wazuh SIEM.
You can find the project files and configuration templates in my GitHub repository:
👉 Malicious Command Execution Detection on Linux
How It Works
The detection pipeline is designed to be streamlined and efficient:
Linux Command
     ↓
   Auditd
     ↓
Audit Log (/var/log/audit/audit.log)
     ↓
Wazuh Agent
     ↓
Wazuh Manager (Rule Engine)
     ↓
Security Alert (Wazuh Dashboard)- Auditd hooks into kernel syscalls and records specific binary executions using custom rule keys.
- Wazuh Agent reads the Auditd log stream and forwards the events securely to the Wazuh Manager.
- Wazuh Manager evaluates custom rules against the incoming audit keys to identify high-risk activity and trigger actionable security alerts.
Tools Used
| Tool / Technology | Role in Project |
|---|---|
| **Ubuntu / Debian Linux** | Monitored Linux endpoint / test machine |
| **Auditd** | Linux audit subsystem for tracking command execution and privilege escalation |
| **Wazuh Agent** | Endpoint telemetry collector forwarding audit logs to SIEM |
| **Wazuh Manager** | Central SIEM correlation engine evaluating custom XML detection rules |
| **MITRE ATT&CK** | Threat classification framework for mapping detections (e.g., T1046, T1041, T1059, T1548) |
Step 1: Install Auditd
Install Auditd on the monitored Linux machine:
apt install -y auditdStart and enable the Auditd service:
systemctl enable auditd
systemctl start auditd
Verify that the audit subsystem is active:
auditctl -sStep 2: Add Auditd Rules
Create a dedicated rules file to track privilege escalation and suspicious utility commands:
nano /etc/audit/rules.d/privilege-escalation.rulesAdd the following monitoring rules:
-a always,exit -F path=/usr/bin/nc -F perm=x -k netcat_exec
-a always,exit -F path=/usr/bin/nmap -F perm=x -k recon_exec
-a always,exit -F path=/usr/bin/curl -F perm=x -k data_exfil
-a always,exit -F path=/usr/bin/wget -F perm=x -k data_exfil
-a always,exit -F path=/usr/bin/python -F perm=x -k script_exec
-a always,exit -F path=/usr/bin/perl -F perm=x -k script_exec

-a always,exit -F path=/usr/bin/sudo -F perm=x -k sudo_exec
-a always,exit -F path=/bin/su -F perm=x -k su_exec
-a always,exit -F path=/bin/bash -F euid=0 -F perm=x -k root_shell
-a always,exit -F path=/bin/sh -F euid=0 -F perm=x -k root_shell
-a always,exit -F path=/usr/bin/pkexec -F perm=x -k pkexec_exec
Reload the audit rules into the kernel:
augenrules --load
systemctl restart auditd
Verify that the rules are loaded into memory:
auditctl -lMonitored Commands & Audit Keys
These rules monitor execution permissions (perm=x) and assign specific audit keys for categorization:
| Command / Binary | Audit Key | Monitored Threat Activity |
|---|---|---|
| `nc` | `netcat_exec` | Network connectivity, listener creation, or reverse shells |
| `nmap` | `recon_exec` | Port scanning and internal reconnaissance |
| `curl` | `data_exfil` | Web transfers, script downloading, or data staging |
| `wget` | `data_exfil` | Binary downloading or outbound data staging |
| `python` | `script_exec` | Python interpreter execution and script running |
| `perl` | `script_exec` | Perl interpreter execution and one-liner payloads |
| `sudo` | `sudo_exec` | Administrative privilege escalation attempts |
| `su` | `su_exec` | User switching / Root shell escalation |
| `bash` (`euid=0`) | `root_shell` | Spawning interactive root bash shell |
| `sh` (`euid=0`) | `root_shell` | Spawning root Bourne shell |
| `pkexec` | `pkexec_exec` | PolicyKit privilege escalation execution |
Step 3: Send Auditd Logs to Wazuh
Next, configure the Wazuh Agent on the monitored endpoint to ingest the Linux audit log (/var/log/audit/audit.log) and forward it to the Wazuh Manager.
Edit the agent configuration file:
nano /var/ossec/etc/ossec.confAdd the following <localfile> block inside the <ossec_config> section:
<localfile>
  <log_format>audit</log_format>
  <location>/var/log/audit/audit.log</location>
</localfile>
Restart the Wazuh Agent service to apply the configuration:
systemctl restart wazuh-agentNow the Wazuh Agent will continuously read the Auditd log stream and ship all execution events directly to the Wazuh Manager.
Step 4: Create Wazuh Detection Rules
On the Wazuh Manager, define custom detection rules that inspect incoming Auditd events for our configured audit keys and map them to MITRE ATT&CK techniques.
Open the local rules file on the Wazuh Manager:
nano /var/ossec/etc/rules/local_rules.xmlAdd the custom rules for malicious command detection and privilege escalation:
<group name="malicious_commands">
  <rule id="100200" level="13">
    <if_sid>80700</if_sid>
    <field name="audit.key">netcat_exec</field>
    <description>Netcat execution detected</description>
    <mitre>T1046</mitre>
  </rule>
  <rule id="100201" level="12">
    <if_sid>80700</if_sid>
    <field name="audit.key">data_exfil</field>
    <description>Potential data exfiltration command executed</description>
    <mitre>T1041</mitre>
  </rule>
  <rule id="100202" level="12">
    <if_sid>80700</if_sid>
    <field name="audit.key">script_exec</field>
    <description>Scripting language execution detected</description>
    <mitre>T1059</mitre>
  </rule>
</group>

<group name="privilege_escalation">
  <rule id="100101" level="14">
    <if_sid>80700</if_sid>
    <field name="audit.key">su_exec</field>
    <description>su command executed – root shell attempt</description>
    <mitre>T1548</mitre>
  </rule>
</group>
Restart the Wazuh Manager to load the new detection rules:
systemctl restart wazuh-managerStep 5: Test the Detection
Now simulate activities by running commands on your monitored Linux test machine.
For example:
nmap 127.0.0.1
curl https://example.com
sudo id
su -
You can inspect the local Auditd log directly on the Linux endpoint using ausearch:
ausearch -k recon_execor:
ausearch -k data_exfilWazuh should process these events and generate alerts when the configured rules match.
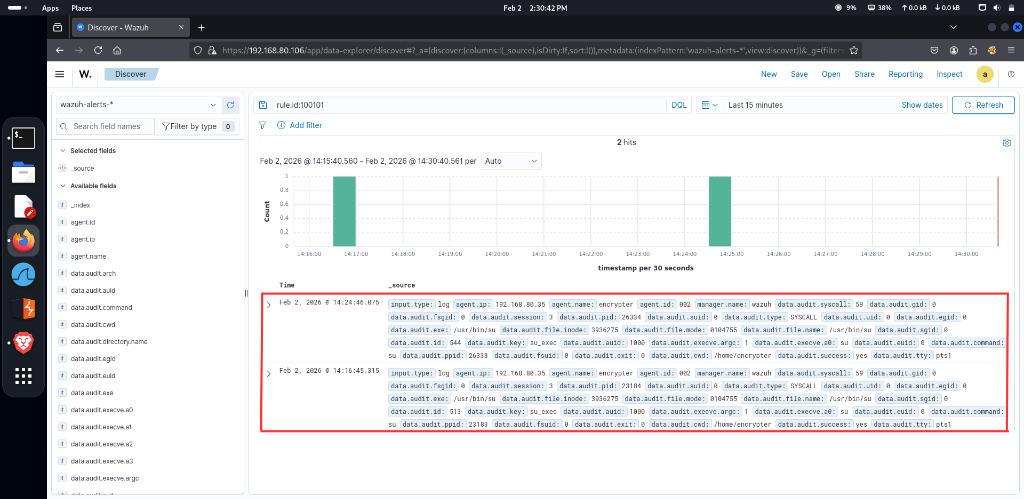
Telemetry Breakdown in Wazuh Dashboard
Inspecting the triggered alert in the Wazuh Discover interface reveals critical forensic metadata:
- Rule ID
100101(Level 14 - High Severity): Triggered when thesubinary is executed, matching our custom rule with MITRE ATT&CK technique T1548 (Abuse Elevation Control Mechanism). - Audit Key (
data.audit.key):su_execconfirms the match against our Auditd rule. - Executable Path (
data.audit.exe):/usr/bin/suidentifies the exact binary invoked. - Syscall (
data.audit.syscall):59represents theexecvesystem call on x86_64 Linux. - User & Session Attribution: Tracks
data.audit.auid(1000for the original logged-in user),data.audit.euid(0for root), and the working directorydata.audit.cwd(/home/encrypter).
What I Learned
This project helped me understand how Linux command execution can be monitored using Auditd and converted into useful SIEM alerts with Wazuh.
The main idea is:
- Auditd = Collect events at the kernel and syscall level.
- Wazuh Agent = Collect and send events securely.
- Wazuh Manager = Parse, correlate, and detect suspicious activity.
This detection architecture can be expanded later by monitoring command arguments, user IDs, parent process lineage (ppid), outbound network connections, and other suspicious process spawning behaviors.
Conclusion
Detecting malicious activity does not always require a complicated system. With Auditd + Wazuh, we can create a simple Linux monitoring pipeline that detects selected command executions and generates high-fidelity security alerts.
This project is a practical example of how endpoint logs can be turned into actionable SOC detections.
GitHub Repository:
👉 Malicious Command Execution Detection on Linux
Other Digital Presences
- Buy Me a Coffee: buymeacoffee.com/jaseervk
- GitHub: github.com/jaseervk
- Portfolio: www.jaseervk.com
- Blog: blog.jaseervk.com
- LinkedIn: linkedin.com/in/jaseer-vk-
- Medium: https://medium.com/@jaseervk321